AI-Powered Literature Mapping: The Key Features of Connected Papers and Pricing Plans Explained<span class="wtr-time-wrap after-title"><span class="wtr-time-number">12</span> min read</span>
This article explains Connected Papers, an AI support tool for researchers.

When starting new research or gathering references for a paper, finding relevant studies can take a lot of time.
Even after hours of searching, it’s still possible to miss an important paper.
Many researchers share these concerns:
“I want to find all the related studies.”
“I want to start my research by reading the most relevant papers.”
With Connected Papers, this entire process is streamlined. It helps you to quickly identify related works and visually understand how closely each paper is connected to your topic.
And the best part: the free plan is more than enough for most research needs.
Official Website: Connected Papers (https://www.connectedpapers.com/)
7 Key Features of Connected Papers
Key Points
Connected Papers Feature 1: Visualize Related Papers
On the Connected Papers home page, you simply enter the title, DOI, PMID, keywords, or other information for the paper you want to use as your starting point:
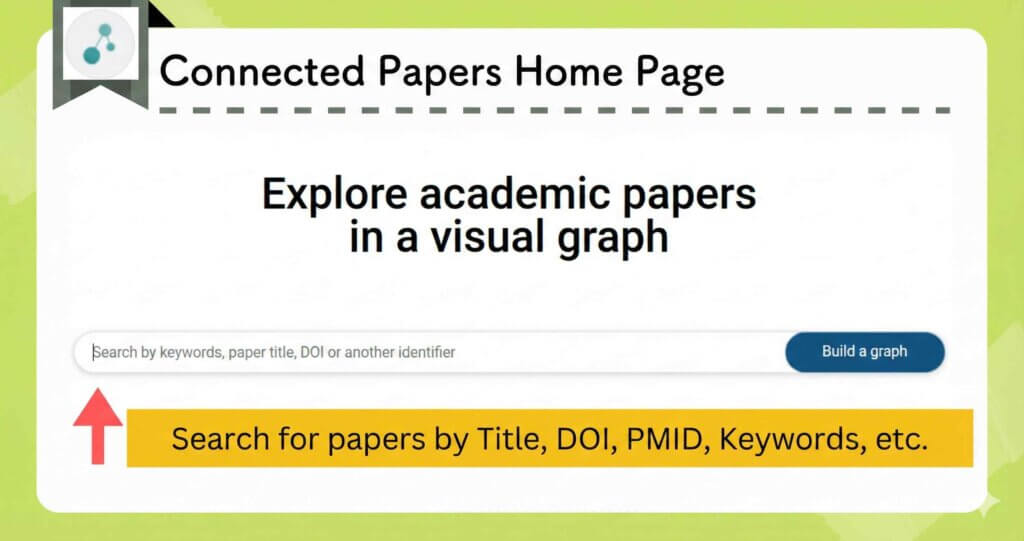
The paper that matches your query will then be displayed. Select it and click the “Build a graph” button to proceed.
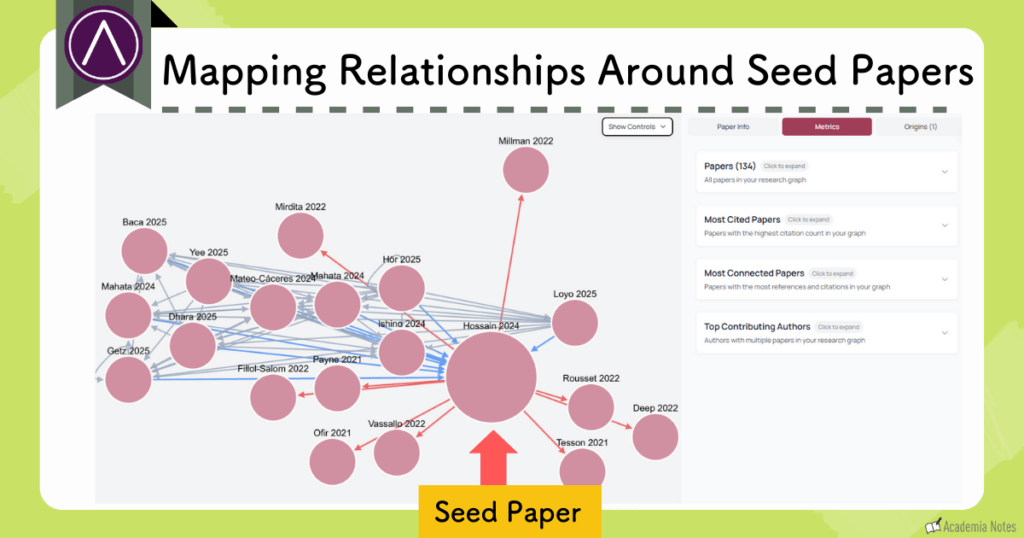
Connected Papers will then generate a visual graph of other literature related to the paper you selected:
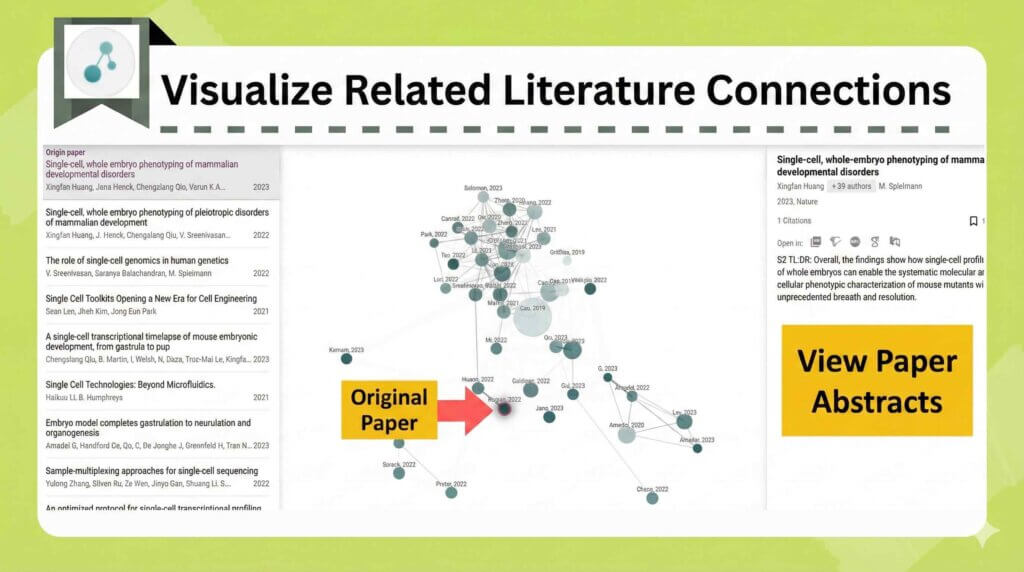
The resulting graph makes it easy to visually grasp both the volume of related literature and the strength of the connections between those papers.
Clicking on any node—or any item in the list on the left—displays detailed information about that paper in the right-hand panel.
You can generate a new graph based on any of the related papers by selecting “Open graph.”
You can also rebuild the graph using a selected paper as an additional seed by selecting “Add origin.”
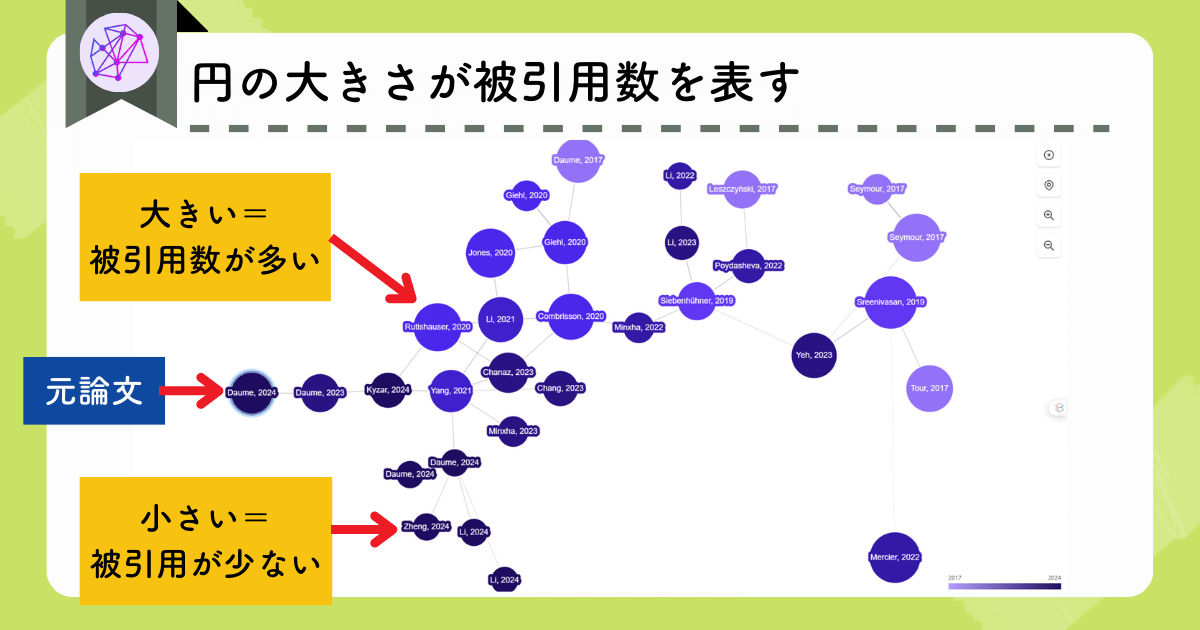
Connected Papers Feature 2: Circle Size Represents Citation Count
The size of each node reflects how many times that paper has been cited:
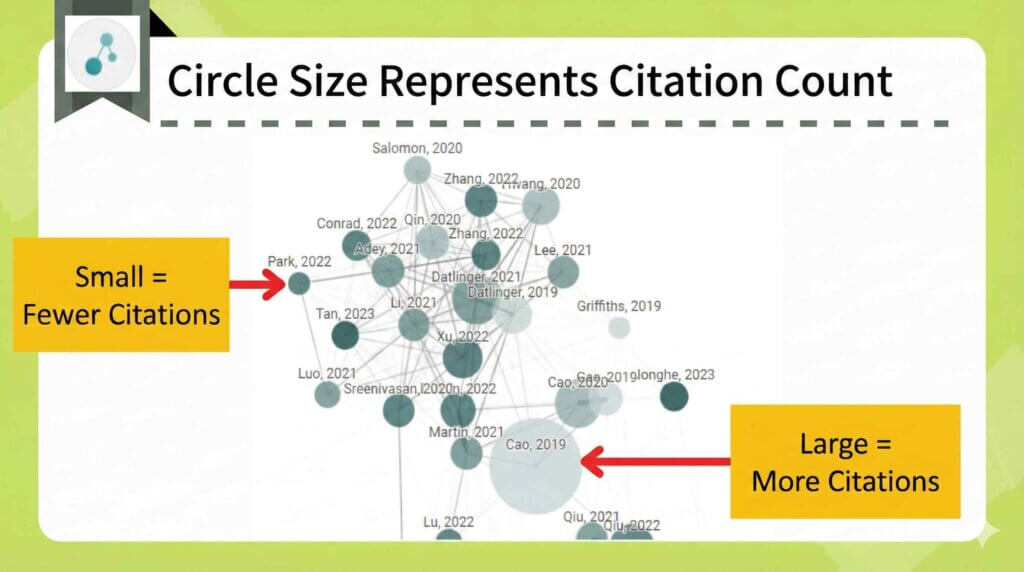
Papers with higher citation counts appear as larger nodes, while those with fewer citations appear smaller.

Larger nodes generally indicate studies that have had a greater impact in their field.
Connected Papers Feature 3: Circle Color Indicates Publication Year
The color of each node represents the publication year of the paper:
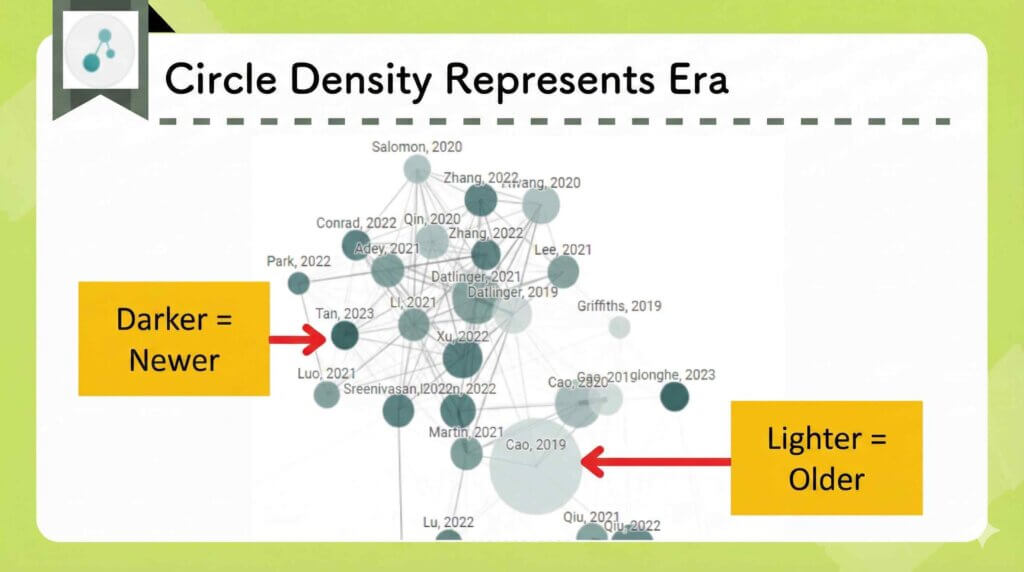
Darker nodes represent newer publications, while lighter nodes indicate older ones.
If you want to get a sense of current trends, it’s helpful to focus on the more recently published papers.
Connected Papers Feature 4: Circle Proximity Reflects the Strength of Connections Between Papers
Nodes positioned closer together represent papers with a strong degree of relevance to one another.
When reviewing the graph, it’s usually most efficient to begin by examining the papers located nearest to your seed paper.
Connected Papers Feature 5: Use List View and Filters
Clicking “List view” in the upper-right corner switches the graph to a simple list of papers:
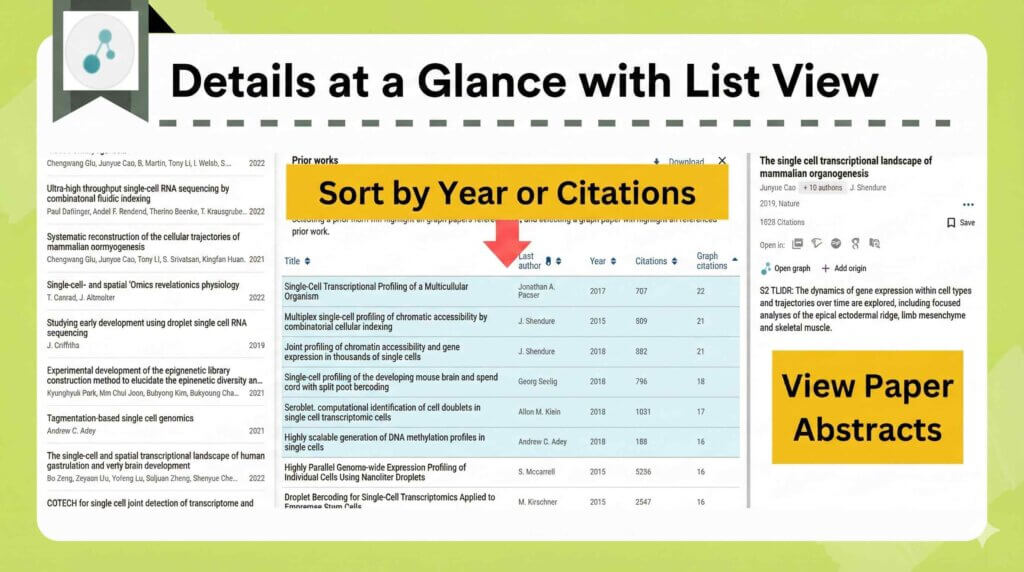
Papers with higher relevance appear toward the top of the list.
You can also sort the results by publication year or by citation count.
The “Filter” option allows you to narrow the list further by keywords or by publication year.
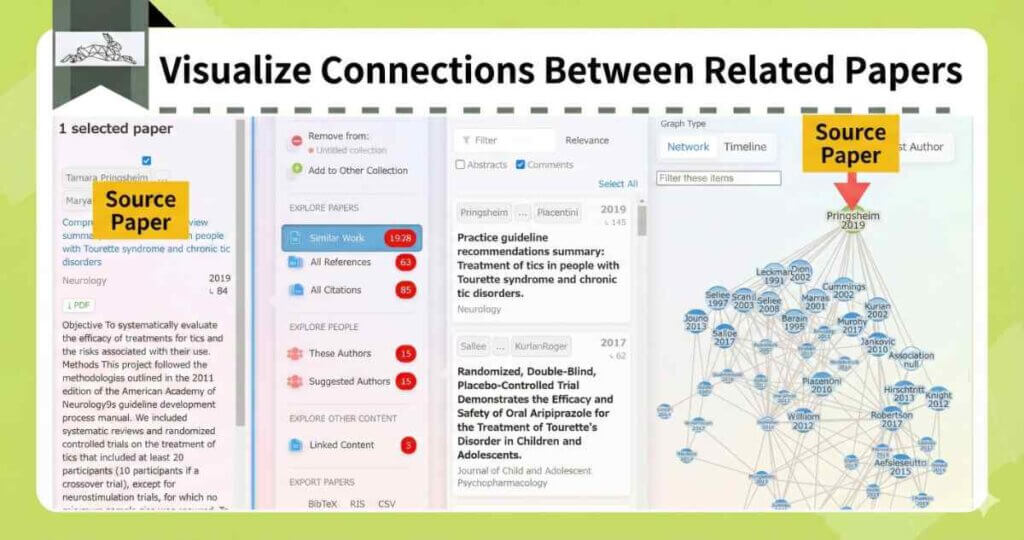
Connected Papers Feature 6: Identify Prior Works
Selecting “Prior works” in the upper-right corner displays the papers that are most frequently cited by the studies in the graph.
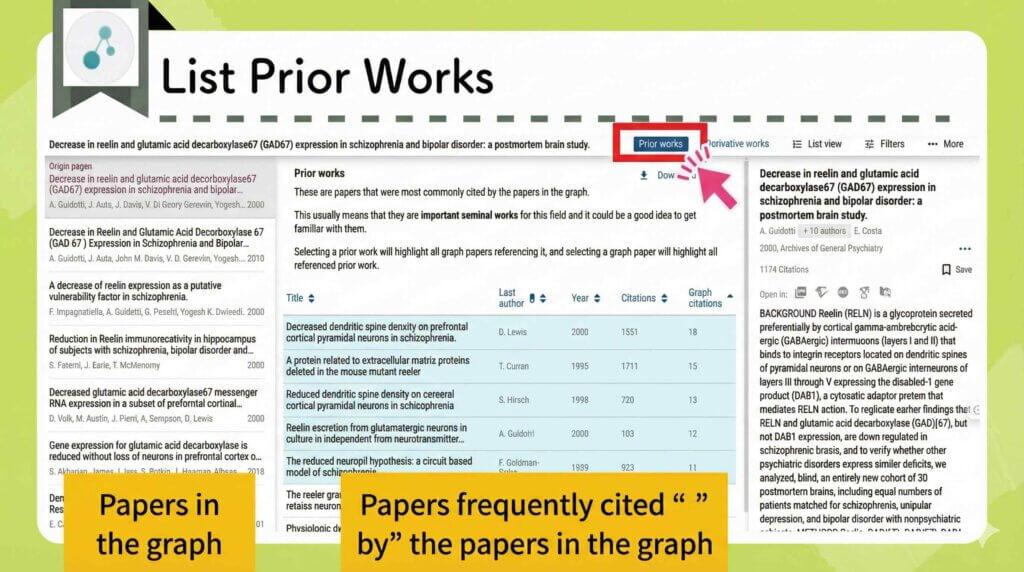

In other words, you can quickly identify the influential, foundational studies that have shaped the field.
Every research area has those ‘key papers’ that everyone cites.
Using Connected Papers ensures you won’t overlook them.
Connected Papers Feature 7: Explore Derivative Studies
Clicking “Derivative works” displays the research papers that were influenced by the studies in the graph.
This feature is extremely helpful when you want to understand how later research has built on earlier work, which may lead you to the discovery that:
“The things I thought were still unexplored have already been examined”
Connected Papers lets you verify whether that’s the case.
Official Website: Connected Papers (https://www.connectedpapers.com/)
Disadvantages of Connected Papers
Usage Limits on the Free Plan
With the Free Plan, you are limited to generating no more than five graphs per month.
Inability to Generate a Graph from Multiple Seed Papers
Connected Papers builds its graph from a single seed paper.
If you want to analyze the relationships stemming from several papers at once, this limitation can make broader searches a little inconvenient.
Connected Papers Pricing Plans
Paid Plan Pricing
| Free Plan | Academic Plan | |
|---|---|---|
| Annual Subscription | Free | $6 per month |
The Business Plan is intended for individuals who use Connected Papers as part of commercial or for-profit work.
Both the Academic Plan and the Business Plan offer the same features, including unlimited graph generation every month.
Difference Between the Free Plan and the Paid Plans
The only difference between the free and paid plans is the number of graphs that can be generated.
With the Free Plan, you can create up to five graphs per month.
| Free Plan | Paid Plan |
|---|---|
| Up to 5 graphs per month | Unlimited |
It’s a good idea to start with the Free Plan, and if you find yourself needing more than five graphs per month, I recommend upgrading to a paid plan.
Additionally, any graphs you’ve already created can be viewed as many times as you want—even on the free plan.
Official Website: Connected Papers (https://www.connectedpapers.com/)
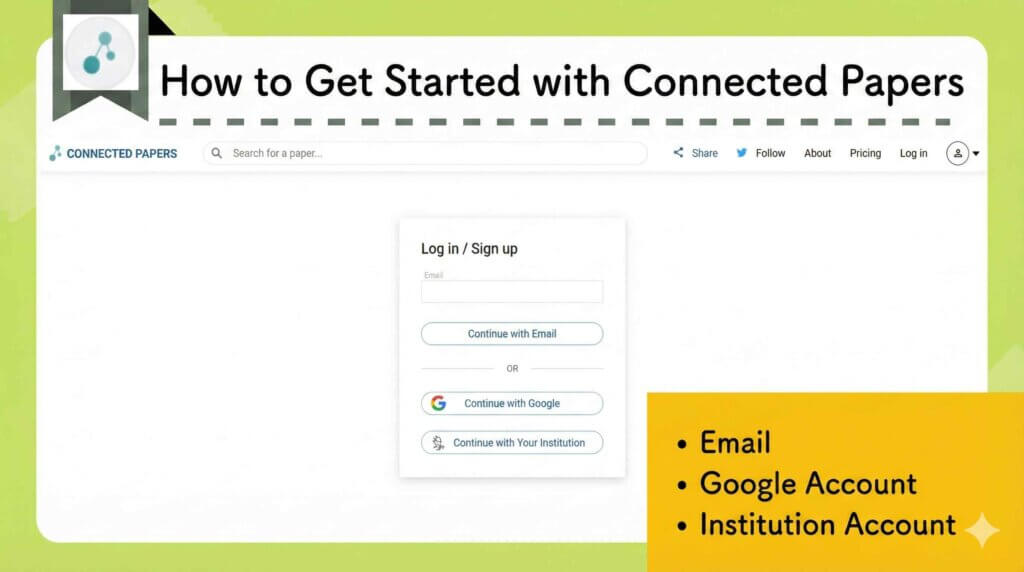
How to Get Started with Connected Papers
Access the official website.
Press the “Log in” button in the upper-right corner.
Enter your email address or use your Google account to sign up:
How to Upgrade to a Subscription
Click the profile icon in the upper-right corner of the screen and select “Upgrade.”
From there, choose the plan you want to subscribe to.
If you’re an individual looking for the lowest-cost paid option, the Academic Plan with annual billing offers the best rate.
Payment can be made by credit card, debit card, PayPal, Alipay, or bank transfer.
Because plans renew automatically, you’ll need to cancel the subscription manually if you decide to discontinue the paid service.
Tools Similar to Connected Papers
Four other tools offer similar functionality to Connected Papers:
AnswerThis

Many tools offer paper-relationship visualization as a standalone feature, but AnswerThis includes it as part of an all-in-one research platform.
You can search for papers and immediately dig into related literature within the same tool, making the workflow remarkably smooth.
See the articles below for more details!
Official Website: AnswerThis (https://answerthis.io)
User Guide: [Latest Research AI] What is AnswerThis? Detailed explanation of 7 key features and pricing plans
AnswerThis is especially strong when it comes to conducting literature reviews, so it’s worth keeping that in mind as you explore what the tool can do.
Research Rabbit

Research Rabbit visualizes related papers in a graph format similar to Connected Papers:
Research Rabbit also integrates with Zotero, which makes uploading and managing papers much easier.
You can dive deep into related literature with Research Rabbit as well.
When a paper catches your attention, click it to reveal detailed information, and you can continue exploring the network from there.
Compared with Connected Papers, Research Rabbit tends to display a larger number of papers, making it a good option for researchers who need a more in-depth exploration of the literature.
Official Website: Research Rabbit (https://www.researchrabbit.ai/)
User Guide: What is Research Rabbit? An active researcher explains the AI tool that visualizes related papers
Research Rabbit is completely free to use.
Scite

Scite is a tool for analyzing citations in academic literature. It classifies each citation as supporting, disputing, or merely mentioning the original study.
It then color-codes these citations according to their classifications, making it easy to see how later research positions itself in relation to the paper you’re examining:

You can also visualize these relationships as a network, similar to Connected Papers:
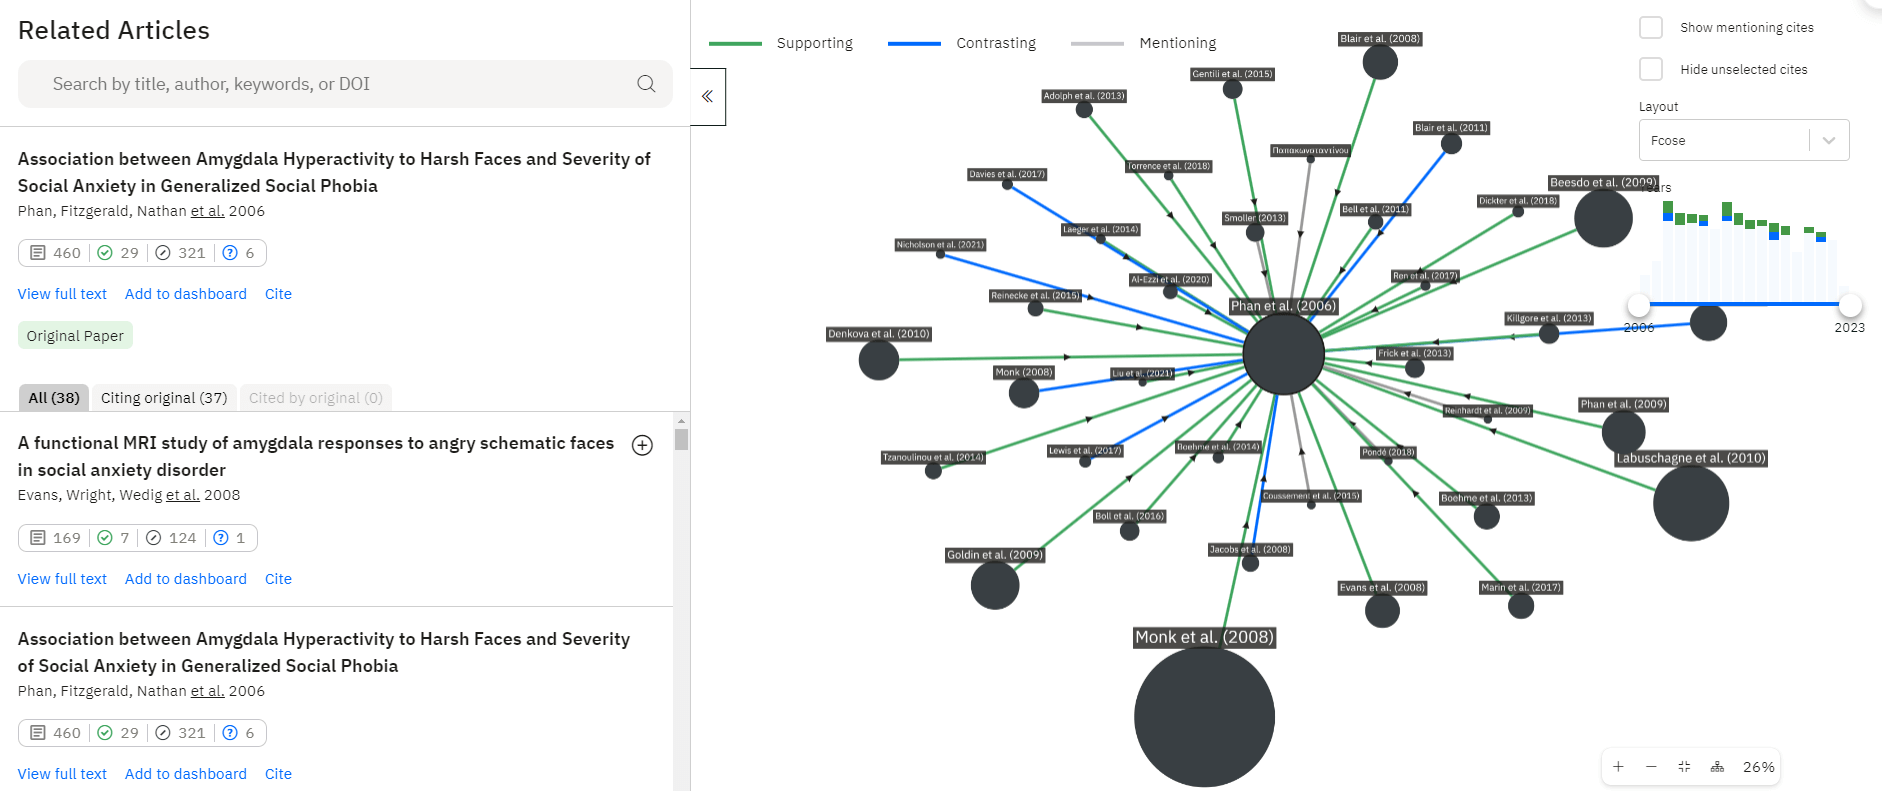
From the above diagram, you can interpret the following:
- Green arrows: supporting citations
- Blue arrows: disputing citations
- Gray arrows: neutral mentions
- Circle size: total citation count
Scite is the only tool that distinguishes citation stance in this way.
Official Website: Scite (https://scite.ai/)
User Guide: [Explanation by an active researcher] How to use Scite and its advantages: AI checks paper Citations!
Inciteful

Inciteful is also a tool that, like Connected Papers, visualizes related studies in a graph:
By uploading a Bibtex file, you can import multiple papers at once.

Inciteful can be used for free with no usage limits.
Moreover, you don’t even need to create an account, which makes it especially convenient for quick exploration.
Official Website: Inciteful (https://inciteful.xyz/)
User Guide: [Thorough explanation] What are the advantages of using Inciteful? Explanation of 7 recommended features
Connected Papers FAQ
Summary
- Connected Papers makes it easy to visually grasp the structure of related research and understand the broader landscape of the field
- With its filtering options, you can quickly narrow down the papers you need
- You can create up to five graphs per month for free
When writing a paper or starting new research, the last thing you want is a scenario like this one:

“I overlooked an important study!”
Connected Papers helps you avoid the all-too-common pitfall of missing vital papers, making it a valuable resource for anyone involved in academic research.
Try it out and see how it fits into your workflow!
Official Website: Connected Papers (https://www.connectedpapers.com/)